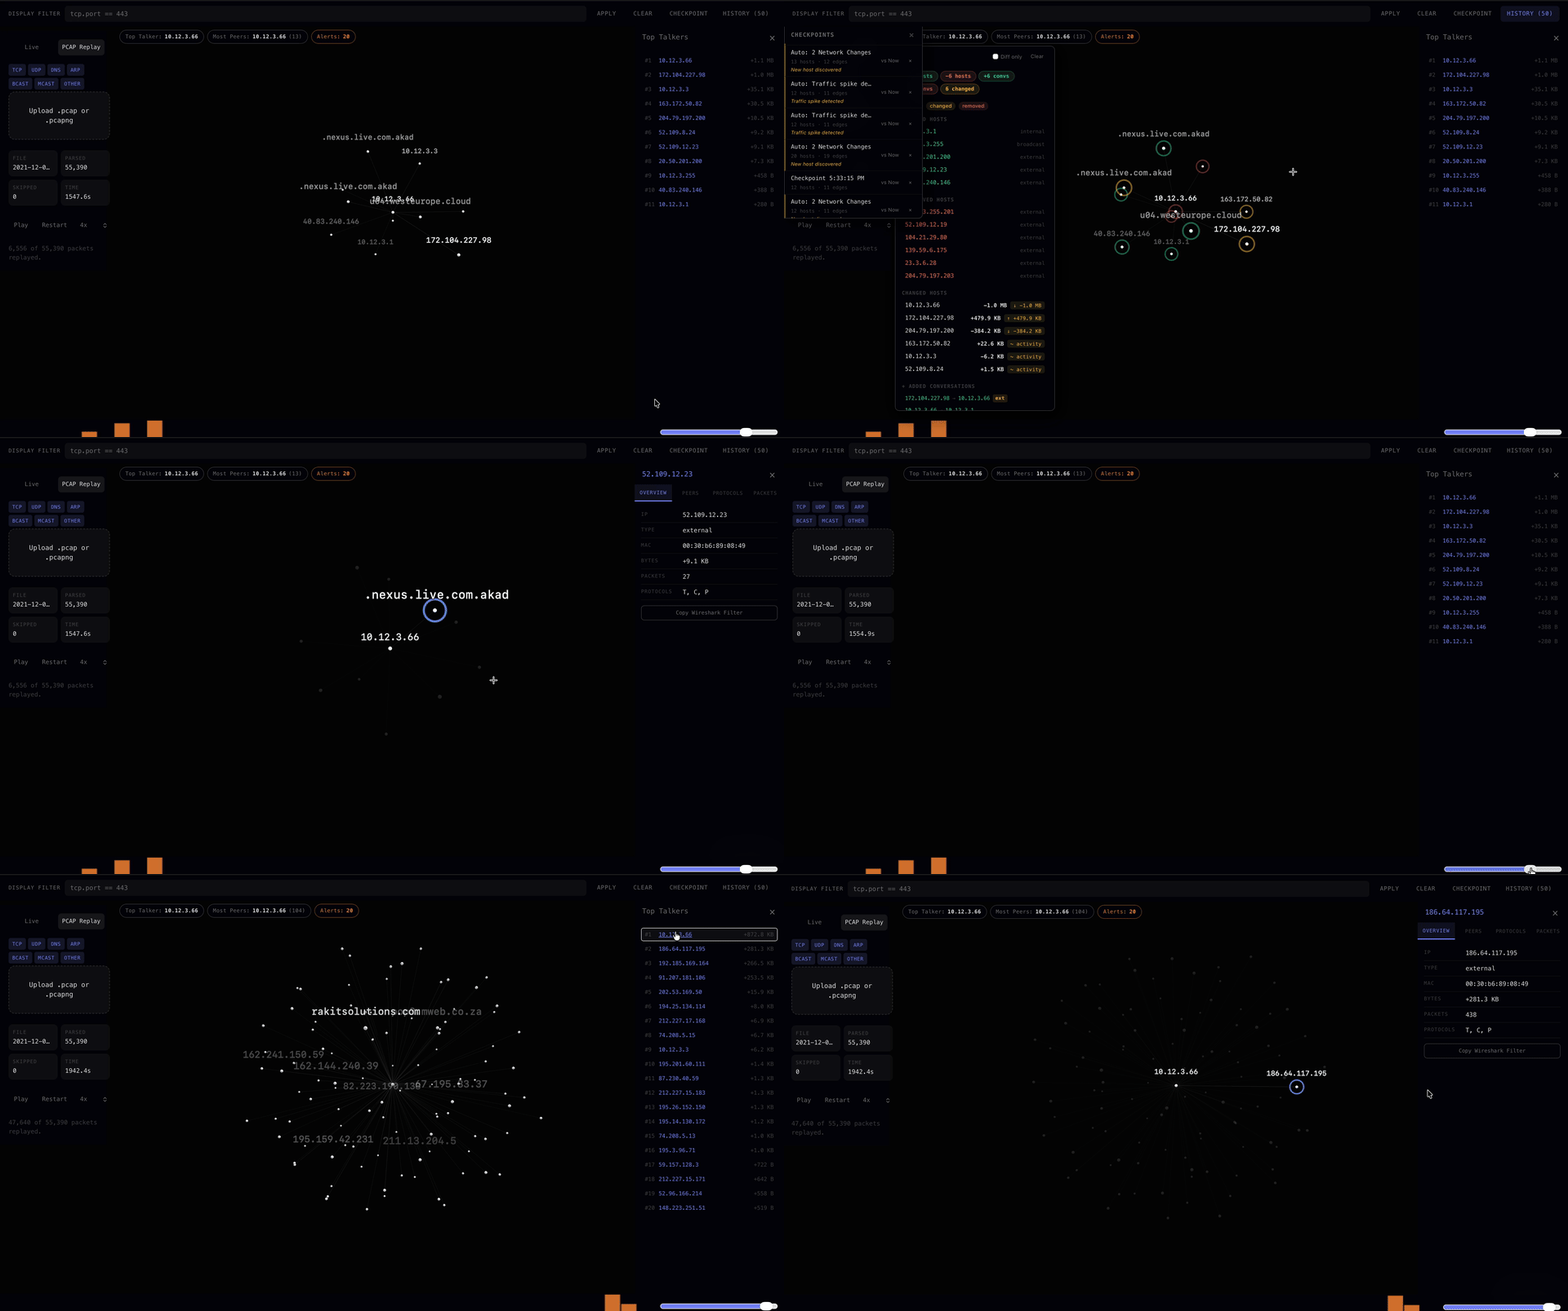
PacMap is a graph-first network traffic visualiser that helps investigators and learners see what changed in a network, identify noisy hosts, and prioritise what to inspect next. It represents hosts and conversations as an interactive graph and focuses on exploration workflows — checkpointing, diffing, and replay — to make pattern discovery faster than scanning raw packet dumps.
How it is used
PacMap supports two complementary workflows: live capture for real-time investigation and PCAP replay for post-hoc analysis. In live mode, a local helper performs packet capture and streams summaries to the browser where the graph updates in near-real time. In replay mode, the browser reads an uploaded capture and replays packet flows over a timeline so the same graph and investigation tools can be applied without needing privileged access.
Features and investigator workflow
The visualization concentrates effort on anomalies and changes. Typical workflows are:
- Explore: begin a capture or load a PCAP and watch hosts appear. Nodes represent endpoints; edges represent conversation volume.
- Filter: apply display filters (Wireshark-style field expressions) to narrow the graph to relevant traffic — for example by protocol, address, or port.
- Trace: activate path tracing between two endpoints to surface intermediate hops and per-edge statistics that help surface likely pivot points.
- Checkpoint & compare: take manual or automatic snapshots of the current graph state and compare two checkpoints to highlight added, removed, or changed hosts and flows.
Installation & running (summary)
The project includes a browser-based frontend and an optional local capture helper that uses Scapy. The frontend runs in a modern browser and supports PCAP replay without the helper. Live capture requires the helper and appropriate local privileges; the repository includes development instructions and a lightweight local server to bridge capture summaries into the UI.
Limitations & privacy
PacMap summarises observed packets into graph elements; it is not a full replacement for packet-level analysis in Wireshark. Large captures may be slow to replay in the browser and some link types or non-IP frames are skipped. Live capture requires elevated privileges — run with care and only on networks you own or have permission to inspect. The tool is intended for learning and investigative use on permitted networks.
Development notes
The frontend uses an interactive WebGL-based graph and a small set of investigation panels (conversations, protocol breakdowns, endpoints). The local helper streams summaries over a WebSocket; for development the UI can be run independently and fed PCAPs for fast iteration.
Troubleshooting
- If the UI reports the helper offline, confirm the helper process is running and that the selected WebSocket port is free.
- If captures show few hosts, generate traffic on the inspected interface (DNS, pings, browsing) to confirm the capture path.
- For large PCAPs, try trimming to a shorter timeframe or using sampling to make replay responsive.
Tech
React + Vite · Three.js · Python WebSocket helper · Scapy